Viewing the Activity Monitor
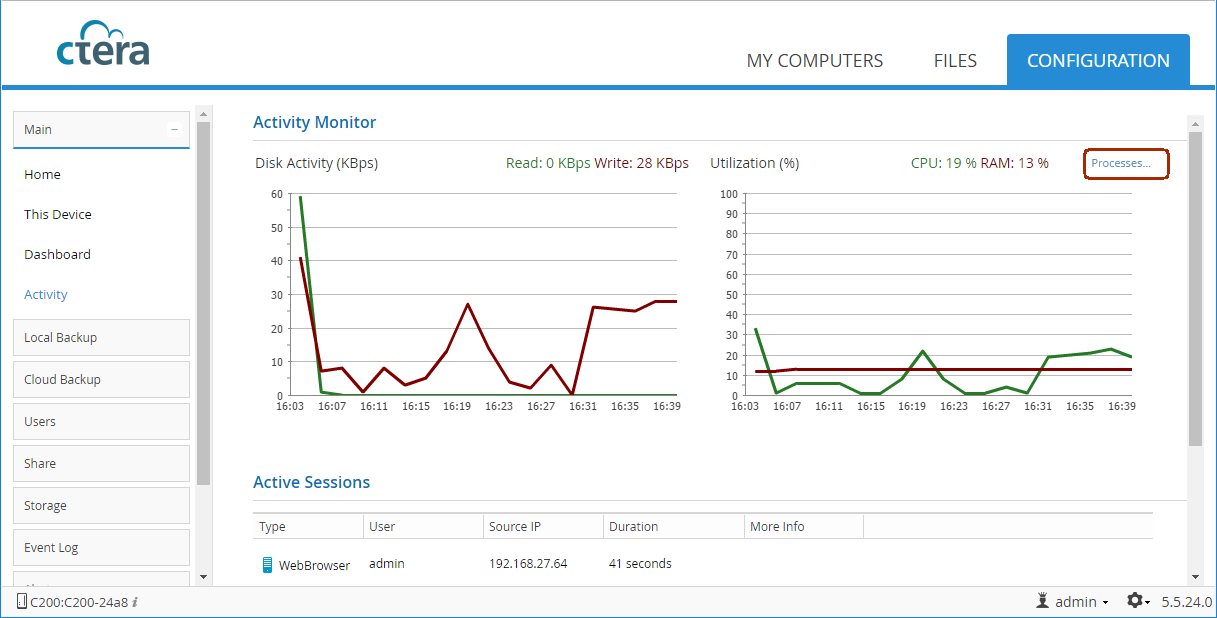
The Activity Monitor provides an overview of the cloud storage gateway's recent activity, including:
• The disk read rate in KBps (kilobytes per second)
• The disk write rate in KBps (kilobytes per second)
• The percentage of CPU in use
• The percentage of memory in use
• A list of active user sessions
• Details about the top twenty processes running on the appliance
To view the Activity Monitor, in the Configuration tab, select Main > Activity.
Under Active Sessions, the following information is displayed:
Type – The session type:
• GUI
• CIFS (Windows File Sharing)
• CTERA Agent
User – The user connected to the cloud storage gateway.
Source IP – The IP address from which the user connected to the cloud storage gateway.
Duration – The amount of time that the user has been connected to the cloud storage gateway.
More Info – Additional information about the session.
Note: The data is refreshed automatically every few seconds.
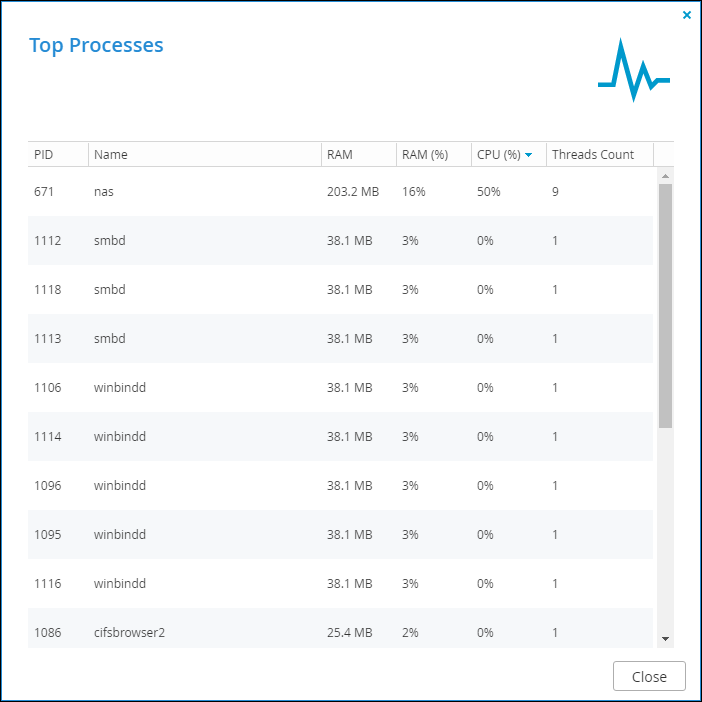
Click Processes... to access the Top Processes window. Top Processes provides information about the top twenty processes currently running on the gateway; data about the processes, and statistics about memory and processor performance.
Where:
PID – The process identifier.
Name – The process name.
RAM – The percentage of the RAM used by this process.
CPU – The percentage of CPU used by this process.
Threads Count – The number of threads spawned by the process.