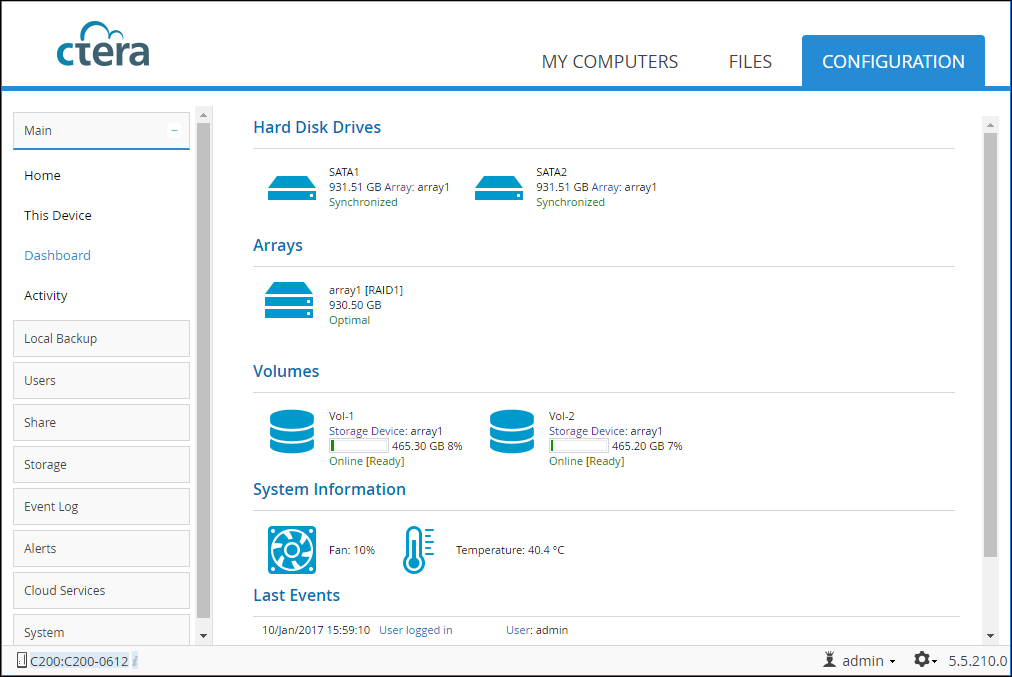
Monitoring Your Cloud Storage Gateway
The cloud storage gateway comes with the following monitoring tools:
• Status dashboard. See below.
• Front-panel LEDs.
Viewing the Status Dashboard
The Cloud Storage Gateway dashboard provides an overview of the gateway's current status, including the following:
• Disk drive and volume information
• Resource utilization information
• Fan activity and the CPU temperature for C-Series Cloud Storage Gateways
• Information regarding scheduled backups
• Recent logged events
In addition, it provides shortcuts to configuring arrays, drives, and volumes.
To view the Status Dashboard:
• In the Configuration tab, select Main > Dashboard.
The dashboard displays the following information:
Hard Disk Drives
All disk drives installed on the cloud storage gateway. For each drive:
• The disk type. Click this link to view additional information about the drive. For further information, see
Checking Drive Diagnostics.
• The disk size in GB. Note that you may notice a discrepancy between the disk capacity stated on the disk's packaging and the disk capacity displayed in the cloud storage gateway Dashboard. This difference is due to the fact that vendors define 1 GB as 1 billion (109) bytes, while computers define 1 GB as 230 bytes.
• The array to which the disk is assigned.
• The disk status:
Synchronized – This drive is in an array and is in optimal condition.
OK – The drive is not in an array and is in optimal condition.
FAIL – The drive has failed.
Unrecognized – The drive contains unrecognized data. You must format the drive before it can be used.
Inactive – This drive is in an array, but is currently not in use.
Rebuilding – This drive is in an array that is currently being rebuilt.
In Use – The drive is currently in use.
Arrays
All arrays defined on the cloud storage gateway. For each array:
• The array name and, for a C-Series gateway, the RAID type. You can click this link to edit the array. See
Modifying Arrays for more details.)
• The array size in GB.
• The array status:
Optimal – The array is in optimal condition.
Degraded – The array is accessible and there is no data loss; however, a disk is failed or missing and, for a C-Series gateway, the array type is RAID1 (Mirroring). Performance and reliability may be reduced. Replace the failed drive as soon as possible.
Fail – The array is not accessible.
Recovering – A degraded array is being repaired. The cloud storage gateway is currently synchronizing out-of-sync members of the array, and performance of the cloud storage gateway may be reduced. Once the recovery is finished, the array will return to optimal state.
Scrubbing – Data scrubbing is in progress.
Volumes
All volumes defined on the cloud storage gateway. For each volume:
• The volume name.
• The storage device on which the volume is located. Click on this link to edit the volume. See
Creating Volumes for further details.)
• The volume's status in the format: Mode [Status]. The mode can be Online or Offline. The status can be:
Key required – The volume is encrypted and requires a key.
Contains errors – The file system needs to be repaired.
Read only – The file system is incompatible with current firmware.
Corrupted – Failed to read the file system status.
Unknown – No file system was found in the volume.
Ready – The volume is ready for use.
Recovering – The file system is being recovered after a non-clean shutdown.
Mounting – Routine cleanup is being performed after a non-clean shutdown.
Formatting – The volume is being formatted.
Converting – The volume is being converted (from EXT3 to NEXT3, or the opposite).
Resizing – The volume is being resized.
Repairing – The volume is being repaired.
Checking – The volume is being scanned for errors.
Checking Quota – The volume's storage quotas are being recalculated.
• A bar representing of the percentage of the volume currently in use, followed by the volume size in GB, followed by the percentage of the volume currently in use.
• CPU fan activity, reported as a percentage of the fan’s maximum RPM capability.
• CPU temperature, reported in degrees Celsius.
Last Events
The last five important events in the cloud storage gateway Event Log. For information on log fields, see
Viewing Logs.
Note: The data is refreshed automatically every few seconds.